• Home
  • Booklets/Grouped Entries
  • Tech Tsunami
  • List of Entries to Date
  • About the Author

usrevolution5

~ USA Headed for a 5th Revolution! Why?

usrevolution5

Monthly Archives: February 2017

#239 Cha 4: Unemployment Rate: A Lagging Indicator

19 Sunday Feb 2017

Posted by Jordan Abel in Economics, Gov't Policy

≈ 1 Comment

First-time readers, the dialogue in this blog is set in the future (sometime after the year 2020).  Each entry assumes there has been a 5th revolution in the US — the Revenge Revolution.  More about Revenge Revolution and author, Entry #1.  List and general description of entries to date.  Annual assessment if Revolution plausible.

Note: most characters appear in a number of entries, with many entries building on previous conversations.  Profile of characters.  You’ll catch on quickly.  Thanks for your time and interest…and comments.

Scene: Gelly, Jordan’s assistant, has been editing and updating a primer Jordan wrote about 2011.  Section starts Entry #235.  (Primer will be available as PDF in more traditional format after the first few entries.  The download will be updated regularly.) 

092615_2031_Characters7.gifGelly:  “Jordan, I finished another section.”

Jordan: “Good.  Which one?”

Gelly: “Unemployment rate.  Several things I didn’t know.”

Jordan: “Such as…?”

Gelly: “The unemployment rate lags behind economic growth.  Until I read your example, I never thought about why changes in the unemployment rate follow other activity.  I also didn’t realize how the rate was calculated.  The idea that the rate can go up as the economy is improving just didn’t seem right at first.”

TurtleneckJordan: “Understand it now?”

Gelly: “I think so.  Here’s the write-up.  I need to make one chart a little more clear.  We should also update some of the information for the Trump Administration.  But everyone should get the idea for now.”

Jordan: “OK, Gelly.  Thanks.”

——————- TEXT of CHAPTER —————

When Obama was president, most Republican politicians and conservative talking heads continually criticized the Administration for not creating more jobs. During president Obama’s first term, a typical comment from the right would be, “There has been no sharp decrease in the unemployment rate.  Therefore the stimulus package and deficit spending has not worked.”

On the surface, the comment seems fair. But what is the unemployment rate and how should we interpret changes in the rate?

How Would You Behave?  Situation: You own a business.  Sales and profits are down.  Lately there has been some uptick in sales but you’re not sure if it will last.  Question: Would you start hiring people the minute sales started to pick up or would you wait to be certain sales were going to continue at a higher level? Answer: Most all business owners wait…and the behavior is logical.

With this behavior in mind, let’s think about the unemployment rate.  If businesses wait to hire more people until they are certain the economy is getting stronger, how should the unemployment rate be characterized – as a “leading” economic indicator or a “lagging” economic indicator?

The unemployment rate is a “lagging” economic indicator – the unemployment rate does not decline until the economy is already weaker and the unemployment rate does not fall until the economy is already improving.  Thus, gains in employment will come after the economy has started to improve.

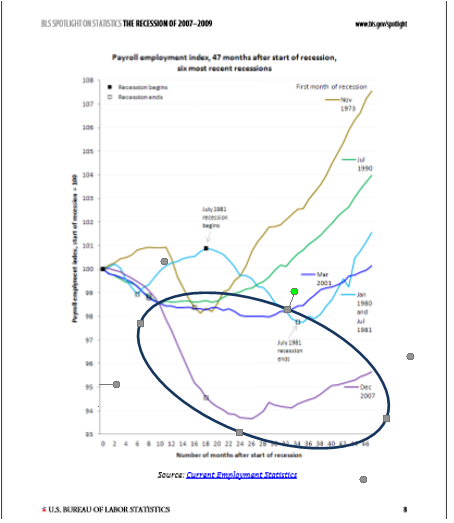
The chart depicts monthly changes in employment.  The data points above the “zero” line indicate increases in employment compared to the previous month.  Data points below the “zero” line indicate losses.  As you review the chart, keep in mind that employment is a “lagging” economic indicator so changes in overall economic activity occur before the changes in employment.   

17-02-18-total-employment-2007-2010

The economic decline that turned into the “Great Recession” started during Bush43’s second term and the decline accelerated sharply as Obama was taking office.  Early in the Obama Administration, Congress passed an economic stimulus package.  These type packages, whether implemented by Republican or Democratic administrations, take time to have an effect on the economy and an even longer time to have an effect on employment. 

Note that beginning October 2008, about 7-8 months after the stimulus package was passed, monthly job losses stabilized and the monthly losses decreased until the beginning of 2010.  Because the unemployment rate is a “lagging” economic indicator, the economy was actually starting to improve even though people were continuing to lose jobs and the unemployment rate continued to increase. 

While it makes for great political theater, those claiming that the economic recovery program implemented by the Obama Administration was a failure, conveniently failed to provide an accurate representation.  The recession of 2007-2008 was labeled the Great Recession because the economy almost sank into a depression.

Just how bad were job loss been compared to previous recessions? Much worse. The job losses were much sharper and more severe than in any other post-WWII recession.  The area within the ellipse reflects the losses in 2007-2008.  Notice how much steeper and deeper the losses are compared to other recessions.  (I’m working on a chart that is easier to read.)

17-02-19-bls-job-losses-recent-recessions-with-highlight


        So, if the job losses were significantly worse than previous recessions, wouldn’t you think any economic recovery should take longer?  Not if you’re a politician of the opposing party.  For all those criticized the Obama Administration for not creating more jobs, the critics should remember who was president when the recession started – and why the recession started.

Explaining the Unemployment Rate

Enough politics. Just what is the unemployment rate?   The unemployment rate is total number of people looking for work but unable to find work divided by the total work force.  The result is “unemployment rate” or percent of the workforce considered unemployed.

Part of the confusion lies in the definition of the “total work force.”  Total work force is the sum of people looking for work and people currently employed. If people are unemployed and have given up looking for work, they are not considered part of the workforce. Huh? Really? Yes, really. Here’s an example.

Situation A. 100 people are available to work – 90 are employed and 10 are unemployed and all 10 are actively looking for work.  Thus, the workforce is 90+10, or 100.  The unemployment rate is 10.0% (1-90/100).

17-02-18-unemployment-table


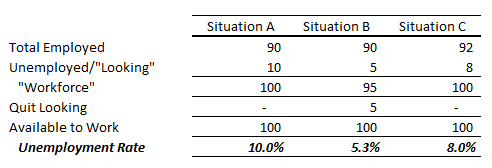
Situation B. Same 100 people as Situation A. However, after several months, 5 out of the 10 people unemployed cannot find work, become frustrated and quit looking for a job. What happens to the unemployment rate? It goes down. Yes, down, even though the total number of people stays the same.

The unemployment rate decreases from 10.0% (10 unemployed out of 100 in the workforce) to 5.3% (5 unemployed out of 95 in the workforce.) The unemployment rate decreases even though the number of people without work stays the same.

Even more confusing is when the economy improves, those who previously quit looking begin looking for jobs.  What happens to the unemployment rate?  The rate may actually increase even though the economy is improving.

Situation C.  Start with Situation B where 10 people were unemployed but 5 of the 10 quit looking for work. Now the economy starts to improve and the five people who quit looking start looking again. Only 2 of the 5 who quit previously find jobs right away but everyone who was not employed is again looking for work.

Situation C now has 92 employed, 8 unemployed.  What happens to the unemployment rate?  The rate jumps from 5.3% in Situation B to 8.0% in Situation C, even though the total number of people employed increased from 90 to 92.  Why?  Because the total workforce – the number of people employed and number looking for work increased from 95 to 100.  (Unemployment rate calculation, (1-92/100=8.0%)

Another problem interpreting the data is the unemployment rate includes workers who have jobs but are working less than full-time. These people are counted as “employed.” Using the same 100 people, if 15 are working say 30 hours per week instead of 40 hours per week, the 15 would be counted as “fully employed,” even if weekly income has been reduced.

While these calculations are not hard to understand, the method used to calculate the unemployment rate is not often explained, especially the effect of “under-employed” or “quit looking for work.” Understanding the methodology will help you explain to others why results of programs to reduce unemployment always lag economic growth.

(Reference material: Bureau of Labor Statistics website has vast array of information about employment, unemployment and how to interpret. http://www.bls.gov)


Advertisement

#238 Primer Cha 3: Is the Federal Debt Too High? Well, Not Really.

12 Sunday Feb 2017

Posted by Jordan Abel in Common Sense Policies, Economics, Federal Budget

≈ Leave a comment

First-time readers, the dialogue in this blog is set in the future (sometime after the year 2020).  Each entry assumes there has been a 5th revolution in the US — the Revenge Revolution.  More about Revenge Revolution and author, Entry #1.  List and general description of entries to date.  Annual assessment if Revolution plausible.

Note: most characters appear in a number of entries, with many entries building on previous conversations.  Profile of characters.  You’ll catch on quickly.  Thanks for your time and interest…and comments.

Scene: Gelly, Jordan’s assistant, has been editing and updating a primer Jordan wrote about 2011.  Section starts Entry #235.  (Primer will be available as PDF in more traditional format after the first few entries.  The download will be updated regularly.) 

092615_2031_Characters7.gifGelly:  “Jordan, can you clarify something for me, please?  Is the Federal debt too high?”

Jordan: “Interesting question.  Why do you ask?”

Gelly: “Some people I know and some of the talk-radio bloviators keep saying…or at least they used to say when Obama was president…that the Federal government’s debt is too high.”

Jordan: “Then let me guess.  The follow-on comment, ‘The country needs to return to the fiscal-conservative days of the Reagan Administration.'”

parrothead_tnsGelly: “Exactly right.”

Jordan: “I find it interesting the claim about Reagan as a fiscal conservative…but what are the facts?  Here’s the question: ‘Since the 1960’s, under which president has the Federal debt as a percent of GDP (gross domestic product) increased the most?  (Note: In the early decades following WWII, Federal debt as a percent of GDP declined sharply.)

Gelly: “First, just what is the Federal debt?”

TurtleneckJordan: “Grab a cup of coffee and I’ll walk you through some of the basics.”

Gelly: “Good.  That should help me understand the rest of the primer.”

Jordan: “For non-economists, the Federal debt is essentially what you think it is…the amount of money the US government owes creditors. The Federal debt is similar in many ways to the debt you owe – mortgage on the house, outstanding car loan, student loan and credit cards.

One major difference. The US government can print money to pay-off its debt; you cannot print money…at least legally.

Is the Federal debt too high? Depends.

CashTo help answer whether Federal debt is too high, first let’s start by roughly adding up all your debt – mortgage on the house, loan on the car(s), outstanding balance on credit cards, etc. Let’s say your debt totals $250,000. If your income is $50,000 per year, your debt of $250,000 is too high. If you make $100,000 per year, your debt is reasonable. If you make $250,000 or more per year, you’re probably in very good shape.

So how do the examples of personal debt compare to the debt of the Federal government? Surprisingly, personal debt is generally higher, often 2-3 times more than household annual income. When you bought your first house, for example, how much higher was your mortgage (with interest) than your annual income?

If you were comfortable getting that big a loan for your house, then relax about the Federal debt.  The Federal debt is much lower proportionately than your personal debt.

Was Reagan a Fiscal Conservative?

The chart indicates debt as a percent of GDP from the 1960’s through early 2017. Most people who view the chart are surprised to learn that debt did not decline under Reagan/Bush.  In fact, under Reagan/Bush 41 debt as a percent of GDP just about doubled — from about 30% of GDP to almost 60% of GDP.  Based on the metrics used by many Republican to claim debt under the Obama Administration was “out of control,” Reagan should have been branded as a president leading the country toward bankruptcy.

17-02-12-gdp-growth-1950-2016

Republicans who brand Democrats as “tax-and-spend” need to be reminded that under the Clinton Administration that followed Reagan/Bush 41, the Federal government ran a surplus and total debt as a percent of GDP declined.  Yes, I understand the sarcasm in what’s supposed to be an apolitical primer.  However, without some prodding and poking, the “alternative facts” crowd will continue to make erroneous claims that Reagan was a fiscal conservative.

Federal debt as a percent of GDP climbed sharply under Bush 43 (2001-2009) Administration from about 55% of GDP to about 80% of GDP.  The primary causes were implementing a major tax cut, which decreased Federal revenues at the same time increasing spending for wars in Iraq and Afghanistan.

Under Obama, Federal debt as a percent of GDP increased sharply at the beginning.  The cause was primarily efforts to overcome a severe recession.  During the recession, which started toward the end of Bush 43, Federal government tax revenues fell sharply and Federal government spending increased sharply to help stimulate the economy.  In the latter years of the Obama Administration, annual Federal deficit declined as did the rate of increase Federal debt as a percent of GDP.

(For those thinking the government should cut back on spending in recessions, there will be a separate entry to explain why, in a recession, fiscal actions for the Federal government and individual households should be exactly the opposite.)  

Under the Trump Administration, debt as a percent of GDP is likely to increase. Trump voodoo-2015958and Republicans are pushing for a major tax cut, similar in many respects to the “trickle-down” tax cuts by Reagan and Bush 43.  “Trickle-down” economics is what Bush 41 famously labeled as “voodoo economics” in the campaign against Reagan.

In addition, Trump Administration has proposed a major infrastructure rebuilding program.  An equally ambitious infrastructure rebuilding program proposed under the Obama Administration was deemed “too expensive” by Republicans.  Apparently, the cost of such a program and the dramatic increase to the Federal deficit are no longer issues.  Mmm, wonder what changed the Republicans thinking?

Trump claims the additional expenses associated with government spending will be offset by additional revenues from accelerated economic growth.  Annual growth in GDP will somehow magically increase to an average 4.0%.  While 4.0% growth in GDP has been achieved periodically since WWII, such a high rate has not been sustained.  Further, the rate is often the result of the stimulus associated with large fiscal deficits.

17-02-12-gdp-growth-1950-2016

Given all the “don’t worry about the deficit because it will magically disappear” rhetoric now that Trump is in the White House, the next time a Republican claims policies of Democrats have crippled the country with debt, note that Reagan and Bush 43 administrations increased debt far more than any other administration since WWII…and Trump is likely to set another record for increasing the debt.  So much for being a “fiscal conservative.”

OK, What Really Caused the Debt to Increase?

  1. Republican-led tax cuts that did not translate into sustained economic growth, thereby creating more debt.
  2. Allowing taxes for Social Security and Medicare to be counted as “general revenues” and effectively used for other purposes. Such “baloney” accounting has allowed both parties in Congress to justify not raising taxes to pay for other programs.
  3. Belief by most Republicans that tax cuts for the wealthy will “trickle down” to middle and lower incomes.  There is no credible evidence to support such claims.
  4. Allowing, and even encouraging companies to relocate manufacturing outside the US, thereby reducing wealth creation and ability to collect tax on payroll and income.

Proposed Simple Changes to Policy.  Following are some simple changes to government policy that would have an immediate and positive impact on US economic growth. Some of these have been proposed previously and some are under consideration by the Trump Administration.  Serious consideration should be given to:

  1. Stop counting tax revenues for Social Security and Medicare as “general revenue.” It is OK to run a Federal deficit. Just make certain the amount of the deficit is understood and not understated by phony-baloney accounting.
  2. Recognizing that people who are unemployed do not need lower taxes.  Unemployed people likely pay no income taxes. Unemployed people need cash.
  3. Recognizing that people who are unemployed/under-employed spend a higher percentage of income than those employed, especially those with higher incomes
  4. Recognizing that people who work have more self-esteem than those who take handouts. Put the unemployed to work, even if the task is ”beneath their skill level.” There are many worthwhile projects that need to be completed.  If you don’t like this idea, then read some accounts of how government programs during the 1930’s New Deal programs positively affected lives of all income strata.  And check your own family history to see who benefitted.”

Gelly: “Thanks for the summary Jordan.  Seems to me for the president and Congressional leaders, maybe the most important guide about proposing changes to government economic policy is use some common sense.  Think before you act…or react to an idea. Thinking before you act was good advice from our parents when we were teenagers. Still relevant today.”


#237 Primer Cha2: Basic Economics and Common Sense Test

05 Sunday Feb 2017

Posted by Jordan Abel in Economics, Societal Issues

≈ Leave a comment

First-time readers, the dialogue in this blog is set in the future (sometime after the year 2020).  Each entry assumes there has been a 5th revolution in the US — the Revenge Revolution.  More about Revenge Revolution and author, Entry #1.  List and general description of entries to date.  Annual assessment if Revolution plausible.

Note: most characters appear in a number of entries, with many entries building on previous conversations.  Profile of characters.  You’ll catch on quickly.  Thanks for your time and interest…and comments.

Scene: Gelly, Jordan’s assistant, has been editing and updating a primer Jordan wrote about 2011.  Section starts Entry #235.  (Primer will be available as PDF in more traditional format after the first few entries.  The download will be updated regularly.) 

092615_2031_Characters7.gifGelly:  “Jordan, are you a dismal guy?”

Jordan: “What are you talking about?  Dismal?  Do I look that bad?”

Gelly:  In your write-up, you said economics has been called a dismal science.  And I know you love economics.  Seriously, I am not sure why it’s called ‘dismal’ since economic-based decisions can have such a profound impact on society.”

TurtleneckJordan: “As you said, I find economics quite exciting. After editing the primer, I hope you don’t think I’m so dismal.”

Chapter 2.  Basic Economics and a Common Sense Test. 

There are some basics of economics that we all need to understand. The “economics wonks” already know the basics…but the wonks aren’t the concern.  The concern is politicians who choose to ignore the data or cherry-pick the data and claim a result that the data do not support.  So, if you’re not an “economics wonk,” the primer is designed to help you understand some terms and statistics that are cited frequently but that you might not understand completely.

drone-manOne of these problems is data are not displayed in easy-to-understand charts. (Pardon me for using a plural verb with data but…OK, so I’m old school.)   In addition, the data are often cited without reference to previous data points or without the proper context. One of the goals of this primer is to explain some economic terms in language for non-economists.

Three comments about the primer before proceeding:

  1. If you want to learn more about a series of data or an economic indicator, start with the Federal government websites.  Bureau of Labor Statistics has an excellent data base and reasonably understandable explanations.  (www.bls.gov)  (Let’s hope the Trump Administration honors the history and integrity of the government’s economic data.  If BLS data are compromised or access denied by the Trump Administration, then check some academic websites – start with MIT, Harvard and Chicago, which all have a long history of Nobel Prize winners in economics.)
  2. The list of databases and examples is not comprehensive but selected to be relevant to discussions.
  3. Not everyone will agree with the items listed and/or the definitions. The primer is just that, a primer, and not a college textbook on economics. Please read it accordingly.

Much of my academic and professional life has included using economic indicators to forecast demand, primarily for sales of cars and trucks. The forecasts have been used to decide: (i) if new assembly plants required; (ii) how many cars and trucks to produce: (iii) what type marketing programs needed: (iv) how many workers required.  These-type decisions can affect the lives and incomes of thousands of people.

Some key lessons learned from many years of forecasting:

  1. Forecasts are always wrong!
  2. Goal should be to minimize the forecasting error for critical variables.  If the forecast is for an item where there is little credible historical data, the default position I use is start at the mid-point of what you think are reasonable high and low estimates. By starting at the mid-point, the worst is the forecast is 50% wrong…and virtually all the time, the error is far less.
  3. Math-based forecasting models are very helpful. The model, however, needs to be easy to understand. If you cannot explain the basics of the model to a non-economist colleague, the model is too complicated

Common Sense Test – Like Some Real Basic Stuff

goofy006Situation #1: A family has no money because no one can find work. Then a family member is employed by the government to complete a task – say building a road or building a school.

Question #1: Is society better off with the person working and being productive or doing nothing…and likely receiving some form of assistance?

Situation #2: “A person has no money and can find work only in minimum-wage jobs.”

Question #2:  Will a person with a minimum-wage job benefit from a tax cut?”

Tax Cuts for the Unemployed?  

When the Bush 43 Administration was faced with declining employment and decreasing real personal income, the answer was not to implement programs similar to the New Deal but to implement tax cuts. I realize parties have platforms and some people are fundamentally opposed to any government programs. But, c’mon, use some common sense. If you were unemployed, would you want a tax cut, which is of no value since you pay little, if any, income tax… or would you want a job that provided cash to buy food, pay the mortgage and utilities? This is not a complicated question.  (Trump Administration – are you listening?  In another segment, we’ll address the societal benefit of “trickle-down” economics.)

Laws of Economics Are Like the Laws of Sciences

The laws of economics are much like the fundamental laws of physics and chemistry. formula-scienceFrom time to time someone claims to have invented a perpetual motion machine that defies the fundamental laws of physics or to have invented a battery that will last forever. And usually sooner rather than later the claims are proved false.

The same seems to apply to some who want to defy the fundamentals of economics. Despite claims to the contrary, wealth for society cannot be created by transferring money between individuals, selling services, offering more medical care or a plethora of other activities.  The only way to create wealth over the long-term is manufacturing.

money-in-pocketTransferring money between pockets helps individuals but offers no benefit to society. Stop and think about it. If you go to the doctor for a problem, where is the value add to society? If you go to a restaurant, where is the value add for society? Money has changed hands but there is no more wealth in society than before.

New-Age Economy Is Horse Pucky

The belief that a new-age “service” economy adds wealth to the country is horse pucky. Yes, certain services may make individuals more productive but at the end of the day, it is manufacturing that creates wealth.

The Chinese get it. I’m afraid many decision-makers in the US don’t get it — whether manufacturing-production-operations-jobsin Congress or in the board room. Unless the US changes policy toward retaining manufacturing and changes the system of rewarding executives for transferring wealth by relocating operations outside the country, the US is headed for a sustained decline in wealth and standard of living.  (In other entries, we’ll discuss: (i) international trade as a critical component of economic growth.  And, no, trade can’t be just one way; (ii) what activities constitute “manufacturing.”  Do economists…and policy makers…need to rethink the definition of “manufacturing”? )

 No country can sustain itself by just providing services and transferring money between pockets. The US needs a healthy manufacturing sector to survive.

(Trump Administration Policies re Manufacturing.  The Trump Administration is right to emphasize the need for manufacturing in the US.  The claim that the US manufacturing base has been completed eroded is false.  The claim that Trump Administration’s policies will bring back manufacturing jobs to industries that formerly included many semi-skilled workers – automotive, e.g. – is sheer folly.  Many semi-Coal Minerskilled and some skilled jobs have been eliminated by technology.  The idea of numerous jobs in “clean coal” is even more ridiculous.  An even greater proportion of mining jobs have been replaced by technology and electricity production is shifting away from coal.  More about these issues in a later entry.)

Subscribe

  • Entries (RSS)
  • Comments (RSS)

Archives

  • March 2023
  • February 2023
  • January 2023
  • December 2022
  • November 2022
  • October 2022
  • September 2022
  • August 2022
  • July 2022
  • June 2022
  • May 2022
  • April 2022
  • March 2022
  • February 2022
  • January 2022
  • December 2021
  • November 2021
  • October 2021
  • September 2021
  • August 2021
  • July 2021
  • June 2021
  • May 2021
  • April 2021
  • March 2021
  • February 2021
  • January 2021
  • December 2020
  • November 2020
  • October 2020
  • September 2020
  • August 2020
  • July 2020
  • June 2020
  • May 2020
  • April 2020
  • March 2020
  • February 2020
  • January 2020
  • December 2019
  • November 2019
  • October 2019
  • September 2019
  • August 2019
  • July 2019
  • June 2019
  • May 2019
  • April 2019
  • March 2019
  • February 2019
  • January 2019
  • December 2018
  • November 2018
  • October 2018
  • September 2018
  • August 2018
  • July 2018
  • June 2018
  • May 2018
  • April 2018
  • March 2018
  • February 2018
  • January 2018
  • December 2017
  • November 2017
  • October 2017
  • September 2017
  • August 2017
  • July 2017
  • June 2017
  • May 2017
  • April 2017
  • March 2017
  • February 2017
  • January 2017
  • December 2016
  • November 2016
  • October 2016
  • September 2016
  • August 2016
  • July 2016
  • June 2016
  • May 2016
  • April 2016
  • March 2016
  • February 2016
  • January 2016
  • December 2015
  • November 2015
  • October 2015
  • September 2015
  • August 2015
  • July 2015
  • June 2015
  • May 2015
  • April 2015
  • March 2015
  • February 2015
  • January 2015
  • December 2014
  • November 2014
  • October 2014
  • September 2014
  • August 2014
  • July 2014
  • June 2014
  • May 2014
  • April 2014
  • March 2014
  • February 2014
  • January 2014
  • December 2013

Categories

  • Affordable Solutions
  • Back Asswards Thinking
  • Background
  • Background Stupid Is as Stupid Does
  • Benefits of Revolution
  • Causes of the Revolution
  • Common Sense Policies
  • Corporate Policy
  • Definitions
  • Diversions
  • Economics
  • Education Issues
  • Federal Budget
  • General Motors
  • Gov't Policy
  • Infrastructure & Fixed Fuel Prices
  • Innovative Thinking: Ideas and Products
  • Lessons of Revolution
  • Personal Stories
  • Possible Solutions
  • Post Trump Presidency
  • Rebranding Black Community
  • Sense Check
  • Societal Issues
  • Stupid Is as Stupid Does
  • Tech Tsunami
  • Uncategorized

Meta

  • Register
  • Log in

Create a free website or blog at WordPress.com.

Privacy & Cookies: This site uses cookies. By continuing to use this website, you agree to their use.
To find out more, including how to control cookies, see here: Cookie Policy
  • Follow Following
    • usrevolution5
    • Join 29 other followers
    • Already have a WordPress.com account? Log in now.
    • usrevolution5
    • Customize
    • Follow Following
    • Sign up
    • Log in
    • Report this content
    • View site in Reader
    • Manage subscriptions
    • Collapse this bar
 

Loading Comments...