• Home
  • Booklets/Grouped Entries
  • Tech Tsunami
  • List of Entries to Date
  • About the Author

usrevolution5

~ USA Headed for a 5th Revolution! Why?

usrevolution5

Monthly Archives: March 2017

#242 Primer Cha 7: Eliminating Incentive to Pillage

25 Saturday Mar 2017

Posted by Jordan Abel in Back Asswards Thinking, Corporate Policy, Gov't Policy, Innovative Thinking: Ideas and Products, Societal Issues

≈ Leave a comment

First-time readers, the dialogue in this blog is set in the future (sometime after the year 2020).  Each entry assumes there has been a 5th revolution in the US — the Revenge Revolution.  More about Revenge Revolution and author, Entry #1.  List and general description of entries to date.  Annual assessment if Revolution plausible.

Note: most characters appear in a number of entries, with many entries building on previous conversations.  Profile of characters.  You’ll catch on quickly.  Thanks for your time and interest…and comments.

Scene: Gelly, Jordan’s assistant, has been editing and updating a primer Jordan wrote about 2011.  Section starts Entry #235.  (Primer will be available as PDF in another few chapters.  Then the primer download will be updated regularly.) 

092615_2031_Characters7.gifGelly: “Jordan, you’ve done it again?”

Jordan: “Done what, again?”

Gelly: “Made me scratch my head.  I just never thought about economic development as an incentive to pillage.  I mean isn’t economic development supposed to create jobs and make everyone wealthier?”

Jordan: “That’s the political line.  OK, some people do benefit.”

TurtleneckGelly: “You mean the executives of the company that’s relocating.  But I never though about the cost of these relocations to the people where the company left and even…”

Jordan: “…even to the taxpayers of the town where the company is relocating.”

Gelly: “If you add up all the costs, the only winners seem to be the company executives.”

Chapter 7: Eliminating the Incentive to Pillage.  Some might view decisions to shutdown facilities and/or relocate manufacturing plants or distribution centers as capitalism at its best. Others view such decisions as capitalism at its worst – an incentive to pillage with no repercussions.

Wall Street SignSenior executives and shareholders of a company can benefit financially from these actions. Senior managers at companies often have a major portion of compensation in stock – 75.0% of total compensation in stock is not unusual.

Stock price, and therefore executive wealth, is highly influenced by short-term earnings. If you do not believe so, look at the effect on the stock price if a company does not meet the quarterly earnings forecast.

While having compensation in stock rather than cash, especially with a claw-back provision (right to “recall” a portion of compensation at a later date) if long-term earnings do not pan out, is a major step forward, executives of the company still have a major incentive to take actions that may be contrary to the best interests of US society.

ScrewedMany executives believe that by relocating operations, the company will lower its costs and in turn increase stock.  The theory of this action – and I emphasize theory – is the wealth of those executives implementing job cuts will increase the company’s stock price.  Screwed in this equation are those people whose jobs are eliminated and who helped build the company and create its value.

This perverse incentive to screw the very people who helped create the company’s value is either not understood or ignored by the public and politicians who make the tax laws. Management of these companies is giving away most of the store – in many cases transferring future wealth creation outside the US – and being rewarded for the transfer. It is as if the country where the new manufacturing plant is located offered current management a kickback – in effect robbing the US – and the US taxpayers are rewarding the management for accepting it.

The same perverse situation occurs when plants relocate elsewhere in the United States. State and local governments offer tax incentives to have plants relocate from one state to another.

Who pays for these relocations?  Tax_Time_Clip_ArtTaxpayers at both locations. The people where the plant was previously located now have a lower tax base. The people where the plant is now located have higher spending to support the facility but without the benefit of taxes from the new company, which usually does not pay its fair share since it was recruited by waiving taxes.

If proper financial analysis were completed, my belief is it would be less costly to society and especially taxpayers, if the company revamped the existing facility rather than relocating to a new facility in another state. While some might view this perspective as socialism, the view is actually one that ensures America remains a vibrant country for generations.

Benefits of Using Existing Manufacturing Facilities  The benefits of using existing manufacturing facilities rather than developing new or “greenfield” facilities are significant. Some benefits of existing over greenfield include:

  • Infrastructure in place and ready. Many new facilities require roads, sewers, high–voltage electric lines, schools and other expensive infrastructure. Existing facilities may need some upgrades but the cost of upgrades will be less than: (i)  building new and (ii) leaving the existing infrastructure in place to be repaired or sit idle and decay. Creating new infrastructure is double taxation on US citizens – once to build the existing infrastructure and again for the new infrastructure.
  • Workers already trained.  While some retraining may be needed, skills of existing workers can be utilized to develop and manufacture products of the same genre as currently produced. Why train someone in auto production in a different part of the US when a large segment of the population in another area is already trained?
  • Lower cost to begin production. When all costs are considered – not just labor costs per hour – revamping and continuing to utilize the existing facilities and workforce are less costly to society than starting new.  Even if a new building is required in the existing location, there are no additional costs for infrastructure or training.
  • Faster turnaround from product concept to production. Skills acquired over many years cannot be taught in a short period, no matter how proficient the trainers.  Even if the current employees are not trained in the latest technology, combining existing skills with those familiar with the latest technology will shorten the development time for new products.
  • Avoiding costs for family relocation. Relocating workers and families includes both the direct cost of relocation and the indirect social cost. While some workers will view the relocation as an opportunity to move beyond the current environment, many of those who want the adventure have already moved. Forcing families to choose between retaining a job and relocation can have a major social cost. The more dominant the company in the area, the higher the social cost of closing the facility and relocating to another area.

An Occasional Exception to the Rule  What if the existing infrastructure and local infrastructure is inadequate to support the company?  In these circumstances, can the relocation be justified?

Yes, if a true case can be made. A few years ago two companies relocated North American HQ from Augusta, GA to Charlotte, NC. – Electrolux, Husqvarna.  While Augusta, a town of about 200,000, had supported these firms and such other companies as EZ-Go and Club Car (both golf cart manufacturers), Electrolux and Husqvarna may have needed a larger community with a more diverse population, stronger academic institutions, international banks, international law firms and access to an international airport.

“Economic Development” Uneconomic.  Do most relocations add jobs to the US market? No. Are there usually incentives to entice the companies to relocate? Yes.

092615_2031_Characters12.gifDo these relocations create a net gain to US society? No. Owners of the business that’s relocating give taxpayers the finger twice.  Taxpayers where the plant was located originally lose a tax base. Taxpayers in the new location pay additional the relocation incentives.  Even for Electrolux and Husqvarna, there is likely a net loss to society rather than a net gain.

 I realize this rationale may seem counter intuitive, especially to those involved with what is often labeled as “economic development.” However, I am waiting for someone to convince me with a  rationale argument that these moves make economic sense.

Yes, the moves make sense for the companies. But the companies are part of a whole. Until we begin considering the impact of such moves on the system – all society – we will be double taxing ourselves with no net gain to the country’s wealth.  Please show me why I am wrong. (BTW, please read Chapter 8 before forwarding your ideas. Thanks.)

#241 Primer Cha 6: Creating Societal Wealth: Manufacturing

12 Sunday Mar 2017

Posted by Jordan Abel in Economics, Gov't Policy, Societal Issues

≈ Leave a comment

First-time readers, the dialogue in this blog is set in the future (sometime after the year 2020).  Each entry assumes there has been a 5th revolution in the US — the Revenge Revolution.  More about Revenge Revolution and author, Entry #1.  List and general description of entries to date.  Annual assessment if Revolution plausible.

Note: most characters appear in a number of entries, with many entries building on previous conversations.  Profile of characters.  You’ll catch on quickly.  Thanks for your time and interest…and comments.

Scene: Gelly, Jordan’s assistant, has been editing and updating a primer Jordan wrote about 2011.  Section starts Entry #235.  (Primer will be available as PDF in more traditional format after Chapter 5 or 6.  Then the primer download will be updated regularly.) 

092615_2031_Characters7.gif

Gelly:  “Jordan, do you really think I’m a pick-pocket?”

Jordan:  “What are you talking about, Gelly?”

Gelly:  “In the primer chapter on creating wealth, you said people in service industries were like pick-pockets.”

Jordan:  “I think you’re wording is a bit of a stretch…but I get the gist of what you’re saying.”

TurtleneckGelly:  “Actually, I liked the analogy.  It helped me understand how wealth is created for a society rather than just an individual.”

———- TEXT of PRIMER ———- 

During summer 2009, which was still early on in the Great Recession, Congress was considering whether to bail out Chrysler and General Motors.  Many people stated that auto companies and auto production did not need to be in the US. In fact, some argued US consumers would be better off if auto manufacturing was done in lower-cost countries outside the US.

dude-with-questionI’m not sure where these people took Economics 101 but all the economics I have studied indicates manufacturing has a direct and positive impact on wealth creation for a country. Wealth for a society is created one way — taking materials and processing them so the end-product is more valuable to buyers than the individual components.

The concept of creating societal wealth through manufacturing is apolitical. Whether your political beliefs are left or right, whether you are a fervent capitalist or fervent socialist, creating wealth for society works the same way – manufacturing.

Printing money can create wealth in the short term. So can mining and selling natural resources. But those resources often finite and are of value only, and only, if processed into another product.

Oil RigFor example, crude oil per se, has no value. Oil is feed stock for plastic and has value to companies manufacturing plastic products. Oil, when refined, has great value today for use in transportation, heating homes and generating some electricity. Oil would have much less value if more electricity and transportation were powered by non-fossil fuels.

Gold has no inherent value.  Gold becomes valuable when it is processed into jewelry, part of electronics components or other products.  Gold’s use as currency is arbitrary.  A society’s currency could be based on certain types of rocks…or even paper, as it is in most countries today.

Understanding how manufacturing creates societal wealth is not difficult.  For example, think of the manufacturing process as starting with iron ore – a bunch of rocks.  Through various steps the rocks are formed into steel.  Through another series Rocksof steps, the raw steel is turned into hoods and fenders for cars/trucks or support beams for industrial buildings. Each step in the manufacturing process adds value to what was originally a pile of rocks with no inherent value.

Farming, in a broad sense, is also manufacturing. Farmers take seeds and through various steps turn the seeds into corn or soybeans. The farmer then sells the corn to others who process it again, Tractorturning the corn into cereal or bio–fuel for cars/trucks. Each time the end product becomes more valuable.

Each step in the manufacturing also creates jobs. At each step, part of the “added value created” is distributed to workers through wages and owners through wages and dividends.

What about companies that offer services?  Do these companies create wealth?  Answer: No.

Service-related companies do not create wealth.  These companies/organizations merely transfer money from one person’s pocket to another person’s pocket. Yes, some individuals may make more money in the transaction but others lose an equal amount. Thus, with services there is no net gain in wealth for society…unless the service makes the manufacturing sector more productive.

taxpayerMedical care, for example, is a service that does not create societal wealth.   The doctor and medical staff may be economically better off after some procedure, but the patient, the insurance company and other taxpayers have transferred funds to the medical staff.   Unlike manufacturing, the doctor, nurse and others involved with patient care, created no wealth for society – they merely picked the other person’s pocket. 

Before you become enraged, just think about medical care.  For a society, the cost of medical care is, in many ways, like a tax. The cost of medical care transfers wealth from one pocket to another but does not create wealth overall.  However, like some taxes (note the term “some taxes”, not “all taxes”), medical care is necessary to sustain a vibrant and productive society.

newspaperRetailing is also a service that creates no societal wealth. The primary benefit of retailing is a convenient venue to purchase manufactured goods. While most people think of retail stores, the “stores” can be physical structures, internet sites, business-to-business sales representatives or even door–to-door sales people.

The contribution retail “stores” make to local economic growth is not well understood. Retail stores, Amazon-like warehouses and other such facilities do not create jobs.  I am always amazed when a new store or Amazon-like warehouse comes to an area where many retail stores exist. The news report often is, “X Brand New Store/Warehouse Coming to Town, 200 New Jobs Created.”

A new store does not create new jobs unless the market is under–represented with retailers. A new store does not cause people to spend more money, but merely reallocates the money being spent among other retailers.

walmart_logoThe reallocation is particularly true for such retailers as Wal–Mart/Sam’s Club, Amazon et al. Wal–Mart/Sam’s Club draws customers from other stores and often pays lower wages than other stores. Further, most of the merchandise in Wal–Mart is manufactured outside the US.

Shoppers at Wal-Mart create a double negative impact on wealth creation by (i) supporting lower–paying jobs that replace higher paying jobs at existing local retailers and (ii) sourcing products outside the US at the expense of manufacturing jobs in the US.

The example should not be construed as anti–Wal-Mart. However, Wal-Mart is no patron saint. If the true economic impact of such stores as Wal–Mart were analyzed, the outcome would likely be negative, not positive.  Amazon has become the ”new Wal-Mart,” with even more erosion of higher-paying jobs and US-manufactured goods.

As a society, we need to understand what economic policies create wealth and what economic policies merely transfer wealth between people‘s pockets.  In many ways, the emphasis on service companies – banks, medical, retail – are like taxes, which transfer wealth between segments of society but create no overall societal wealth.

Trump Administration and Manufacturing.  The promise by Trump during the campaign to bring back former high-labor-content manufacturing jobs is folly.  Yes, manufacturing is critical to create societal wealth but Trumptechnology has replaced much of the labor content in manufacturing.  And the use of technology to replace workers will only continue. 

If there is any doubt about the trend, merely look at agriculture.  The implementation of technology has resulted in enormous gains in output with far fewer workers.   The key for sustaining US manufacturing is not trying to create retro-manufacturing jobs but training workers help support technology for future manufacturing growth.      


#240 Primer: Cha 5 — Trends and Seasonally Adjusted Rates

06 Monday Mar 2017

Posted by Jordan Abel in Uncategorized

≈ Leave a comment

First-time readers, the dialogue in this blog is set in the future (sometime after the year 2020).  Each entry assumes there has been a 5th revolution in the US — the Revenge Revolution.  More about Revenge Revolution and author, Entry #1.  List and general description of entries to date.  Annual assessment if Revolution plausible.

Note: most characters appear in a number of entries, with many entries building on previous conversations.  Profile of characters.  You’ll catch on quickly.  Thanks for your time and interest…and comments.

Scene: Gelly, Jordan’s assistant, has been editing and updating a primer Jordan wrote about 2011.  Section starts Entry #235.  (Primer will be available as PDF in more traditional format after Chapter 5 or 6.  Then the primer download will be updated regularly.) 

Gelly: “Jordan, my apologies.  I’ve fallen behind on editing the primer.  I’m working on catching up but it might be another week or so .”

woman_parentJordan: “No apologies necessary. We both took a week off from the business.  And, yes, I’m behind on some of my work as well.  What’s the topic of the next chapter?”

Gelly: “Seasonally adjusted annual rates and trends.  I confess, it was not a topic that gave me goosebumps.  However… ”

Jordan: “I take the ‘however’ to mean it wasn’t so boring.”

TurtleneckGelly:  “Actually, it was interesting.  Now, I think I understand what it’s all about.”

Jordan: “Good, let’s see what you think we should publish.”

———— CHAPTER 5 ————-

If you thought Chapter 4, the write-up on unemployment was confusing, go grab a coffee. The concept of seasonal adjustments is widely used…and also widely misunderstood.

dude-with-questionEconomic data are frequently reported as being “seasonally adjusted” and equal to an “annual rate.”  Just what does that mean?  A “seasonally adjusted annual rate” (aka, SAAR) is an attempt to predict what sales would be for an entire year, recognizing that sales for many products vary month to month and are not simply 1/12 of the total for the year.

Two examples:

  1. Sales of gift items are higher at certain times of the year – Valentine’s Day, Mother’s Day and especially leading up to Christmas. Sales of these-type items might be very strong one month and fall-off sharply the next month, or months because of the “pull-ahead” effect. The term “Black Friday” originated in the retail business because the Friday after Thanksgiving is when retailers usually began making money for the entire year, or as accounts say “going in the black.”  These monthly swings in sales make it very hard to gauge whether sales are headed up or down.  Without some sort of “seasonal adjustment,” a manufacturer or retailer might view lower sales in January vs. December as negative when in fact the sales pattern might be improving.  The seasonal adjustment attempts to “normalize” sales for the month.
  2. Sales of cars and trucks in the US are lower in the winter months as people spend money on Christmas gifts and delay buying new cars/trucks during inclement weather. Thus, sales of cars and trucks in the winter – and then the spring – need to be “seasonally adjusted” to help gauge whether sales are trending up, down or staying about the same.

Seasonal adjustments are often based on averages of actual data over a given period – say 5-10 years.  Because of changing economic conditions, sales activity in any given year probably will be somewhat different from the “average” sales pattern.  Adjusting the data for individual months or quarters can help determine sales trends.

Calculating Seasonal Adjustments.  While there are some sophisticated techniques to calculating how each month should be adjusted, the reality is for many users there are no Black School Teacherpublished seasonal adjustments.  To create your own seasonal adjustment, start by making a table with at least five (5) years of sales data by month.  If you have 10 years, great.  More than 10 years, stick with 10 years for now.

Begin by adding up sales for all the January’s, then the February’s and each month of the year.  After you have totaled 5 (or 10) years of sales, then divide total January sales by total sales for all five years.  If you’re in the lawn chair business, the “seasonal adjustment” percentage for sales of chairs in January should be less than 8.33% (1÷12).  Sales of lawn chairs in June should be well above 8.33%.

Lawn Chairs Table

To calculate the “seasonally adjusted annual rate for this year’s sales in January, simply divide sales by the January percentage (%).  If January sales in Year 6 were 50 lawn chairs and the “seasonal adjustment” percent was 3.0% (well below average), the seasonally adjusted annual rate of sales would be 1,667 lawn chairs.  If sales of lawn chairs in June were 125 (75 units higher than January) and the June adjustment percent was 12.2% (above average), the annual rate would be 1,000 units – a significant decline from the seasonally adjusted annual rate in January and an indicator that sales might be trending downward.

What Are Trends?  Would you believe someone who claimed the weather last June 12 was an indicator of what the weather would likely be for the next 12 months? In fact, most people would laugh at such an assertion. Yet, many of the same people believe a politician or talking head when single economic data-point is used to justify a claim that a particular program is working or not working.

The period for determining trends can vary.  Depending on the subject matter, reports of activity are issued weekly, monthly, quarterly and some annually. When viewing data, it is important to consider the type of data and how frequently a change becomes meaningful.

Weather Forecast
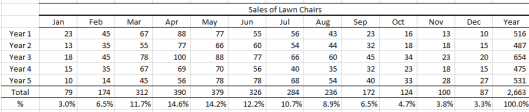
Data for weather may be the most extreme example.  Weather conditions and temperatures change daily, even hourly.  However, what constitutes a change in weather “trend”?  An early frost or a late snowfall might simply be an aberration.  But a pattern of increasing temperatures year after year after year indicates a change in the trend.

But what about trends in economic data or a company’s sales data?  How does one calculate a trend?  Are sales of lawn chairs headed up or down…or staying about the same?

Calculating a trend line can be as simple as plotting data on a chart and then taking a ruler and adjusting it so ½ the data points are above the ruler and ½ are below the ruler.  This “eyeball” method is not a bad place to start.

Lawn Chairs

In this chart of lawn chair sales, the “linear” trend line — i.e., ½ the data points are above the trend line and ½ below the trend line — suggests that:

  • Monthly sales bounce around…a lot
  • Overall, sales are improving…maybe
  • Using data for any single month is not an accurate predictor of other months

OwlA more sophisticated method to fit the data is called “exponential fitting” (think of compound interest rates on your savings). For many sets of data, using an “exponential” trend line provides a more accurate picture of the results. Using an exponential fit, the trend line indicates sales of lawn chairs are flat to falling compared to rising sales using a simpler liner trend line.

While the differences between the linear and exponential lines may not seem significant, if you were in charge of manufacturing for the lawn-chair company, the difference could change your decision. If you looked only at the data using a linear trend, you might add to the production schedule, assuming that sales were likely to increase. However, if you looked the data fitted exponentially, you would not add to the production schedule and might even consider reducing the schedule.

There are several credible methods to calculate trend lines. If you use Excel or a similar program, most have formulae built into the program. Sometime you will also hear these methods referred to as “regressions.” If you decide to use more sophisticated regression techniques to calculate trend lines or “fit the data,” and have not completed college-level statistics – or do not remember – I suggest you read at least two articles on the plusses and minuses of the best approach for a particular task.

MIT LogoTrend lines, aka regressions, can be extremely useful when looking for patterns. When I was a grad student at MIT, there was an oft repeated saying among the professors, “When in doubt run a regression.”

The “when-in-doubt” advice was sound and has served me well over many years in many different jobs and in addressing many different problems. Regressions and trend lines help you create some order out of chaos.

The seasonally adjusted annual rates and the trend lines described in this section can help reduce the risk of making a terribly wrong decision. Try both approaches individually, and then in combination.  I think you will find the approaches very useful.  Just do not make the analysis too complicated.


Subscribe

  • Entries (RSS)
  • Comments (RSS)

Archives

  • January 2021
  • December 2020
  • November 2020
  • October 2020
  • September 2020
  • August 2020
  • July 2020
  • June 2020
  • May 2020
  • April 2020
  • March 2020
  • February 2020
  • January 2020
  • December 2019
  • November 2019
  • October 2019
  • September 2019
  • August 2019
  • July 2019
  • June 2019
  • May 2019
  • April 2019
  • March 2019
  • February 2019
  • January 2019
  • December 2018
  • November 2018
  • October 2018
  • September 2018
  • August 2018
  • July 2018
  • June 2018
  • May 2018
  • April 2018
  • March 2018
  • February 2018
  • January 2018
  • December 2017
  • November 2017
  • October 2017
  • September 2017
  • August 2017
  • July 2017
  • June 2017
  • May 2017
  • April 2017
  • March 2017
  • February 2017
  • January 2017
  • December 2016
  • November 2016
  • October 2016
  • September 2016
  • August 2016
  • July 2016
  • June 2016
  • May 2016
  • April 2016
  • March 2016
  • February 2016
  • January 2016
  • December 2015
  • November 2015
  • October 2015
  • September 2015
  • August 2015
  • July 2015
  • June 2015
  • May 2015
  • April 2015
  • March 2015
  • February 2015
  • January 2015
  • December 2014
  • November 2014
  • October 2014
  • September 2014
  • August 2014
  • July 2014
  • June 2014
  • May 2014
  • April 2014
  • March 2014
  • February 2014
  • January 2014
  • December 2013

Categories

  • Affordable Solutions
  • Back Asswards Thinking
  • Background
  • Background Stupid Is as Stupid Does
  • Benefits of Revolution
  • Causes of the Revolution
  • Common Sense Policies
  • Corporate Policy
  • Definitions
  • Diversions
  • Economics
  • Education Issues
  • Federal Budget
  • General Motors
  • Gov't Policy
  • Infrastructure & Fixed Fuel Prices
  • Innovative Thinking: Ideas and Products
  • Lessons of Revolution
  • Personal Stories
  • Possible Solutions
  • Post Trump Presidency
  • Rebranding Black Community
  • Sense Check
  • Societal Issues
  • Stupid Is as Stupid Does
  • Tech Tsunami
  • Uncategorized

Meta

  • Register
  • Log in

Create a free website or blog at WordPress.com.

Cancel
Privacy & Cookies: This site uses cookies. By continuing to use this website, you agree to their use.
To find out more, including how to control cookies, see here: Cookie Policy